How Are Homes Scored?
A qualified Assessor inspects each home on-site and enters 50 data points into the online Home Energy Scoring Tool. The data collection sheet with the list of data elements and possible values can be found here. After entering all necessary data, the Scoring Tool will provide a summary of inputs for review and prompts the assessor to create the label (Figure 1). After creating the label, data inputs are locked and cannot be changed. The Home Energy Score label can be immediately printed or emailed to the customer. DOE approved, third- party software allows Assessors to submit appropriate fields through an application programming interface (API) and receive the Score and calculated results.
Scale
When developing the scoring system, DOE considered many factors and data sources to fairly compare the energy performance of existing homes. DOE sought to develop a simple system that allows consumers to understand how a home compares to other homes regardless of location and weather patterns. The current methodology is applicable to single-family homes and townhomes or duplexes in the continental U.S. and Alaska. The Scoring Tool scores a home on a 10-point scale, where a 10 corresponds to lowest energy use and a 1 corresponds to highest energy use. Each point on the scale corresponds to a small range of energy use estimates within the full 10-point range.
Compensating for differences in home size and location?
Home Size – A home’s energy use depends on a variety of factors, one of which is its size. Larger homes have more surface area, which translates into greater energy requirements for heating and cooling. A home’s Score is based on estimated annual energy use, not energy per square foot; so, given all other things as equal, a larger home will score lower than a smaller home.
Climate of Location – Home Energy Score uses TMY3 climate data. It maps the zip code for the house address to the nearest weather station. Each weather station has its own definition of Score bin ranges based on local weather.
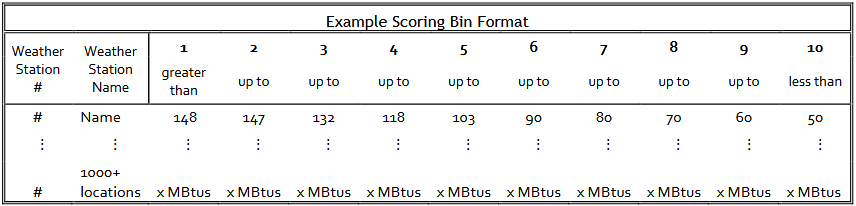
The Home Energy Score Scale: Bin Definitions
Todo
Update with the new methodology and format from ResStock.
The Home Energy Score’s scale is based on RECS 2009 data, which is a survey of residential energy consumption by the Energy Information Administration (EIA). The scale was designed to reflect existing housing stock and also allow for mobility on the scale to encourage home energy retrofits. Seventy-five percent of U.S. homes score between 2 and 9 on the scale, and a home that uses an average amount of energy – in the 50th percentile range of energy use – scores a 5. An example of the MBtu cutoffs between Score bin values is included below, although actual values vary by geographic region and local weather patterns.
Site to Source Conversion Factors
Home Energy Score is based on the source energy for heating, cooling and hot water. Source energy accounts for the inefficiencies related to processing and transporting energy. For example, there are significant losses associated with generating and providing electricity that do not exist with on-site energy generation. The conversion from the site energy value (as calculated by the energy model) and the source energy value is based on national averages conversion factors. These factors reflect updated technical guidance from DOE’s Office of Energy Efficiency and Renewable Energy as of October 2016 updated using 2019 values.
Fuel Type |
Conversion Factor |
|---|---|
Electric |
2.44 |
Natural Gas |
1.05 |
Lpg |
1.01 |
Fuel Oil |
1.01 |
Cord Wood |
1.0 |
Pellet Wood |
1.0 |
Accounting for Residential Solar Installations
Given that a photo-voltaic system (PV) is one of many energy-related home assets, a home’s PV system is credited to the home’s Score. With the release of v. 2017 (Feb 2017), the Home Energy Scoring Tool accounts for PV in three metrics: the Score, estimated electricity usage, and estimated energy costs.
The Score - Home Energy Score Assessors collect PV data consistent with NREL’s PVWatts tool to estimate the system’s annual energy production. To generate a Home Energy Score, the Scoring Tool will subtract the estimated PV annual production (in MBtu) from the estimated energy required to meet the home’s heating, cooling, and hot water needs (i.e., asset loads). This new MBtu value is used to determine the home’s Score – one that reflects all of the home’s major energy-related assets, including PV.
Estimated Electricity Use - The Home Energy Score Report includes a number of additional metrics and values that reflect how much energy is used by and generated at the home. These metrics and values do not include transmission, distribution, and generation losses. The user can distinguish site from source numbers because all MBtu numbers are source; all energy specific units are site energy. For example, the kWh value shown on the Home Energy Score Report is the estimated amount of electricity required on site to meet all of the home’s electricity needs, including plug load. If a home has PV, the total kWh generated by the system is subtracted from the total kWh required to meet the home’s electricity needs.
Estimated Electricity Cost - When a home has PV, Home Energy Score estimates the home’s total electricity costs by offsetting the contribution of the PV system from the home’s modeled electricity use using the state average utility rate.
Cost Savings: What utility rates are assumed?
The Scoring Tool uses the most recent state average utility rates as provided by the DOE’s EIA to determine the estimated cost savings displayed on the first and last pages. The total energy cost for a home with PV will reflect the offset provided by all of the electricity generated by the PV system.
Carbon Savings: Carbon Conversion Factors
To calculate the home’s carbon footprint (measured in lbs CO2), the Scoring Tool multiples the annual energy for each fuel type by the emissions factor for the respective fuel. Natural gas, fuel oil and LPG emission factors are derived from DOE EIA. The U.S. EPA’s Emissions & Generation Resource Integrated Database (eGRID) provides electricity grid emission factors. eGRID contains emissions and resource mix data for virtually every power plant and company that generates electricity in the United States (US EPA, 2009).